5 Daily Habits to Become Better at Data
Spend 5 minutes on these daily and your career will skyrocket!
1. Read documentation
Reading documentation is a skill. If you are early in your career, this habit will help you build your documentation reading muscles.
If you are more experienced and think you know a lot, I would still suggest doing this regularly. Every time I reread the documentation for a Python topic or DAX formula, I find something new. You will not learn the nuances in the first few reads.
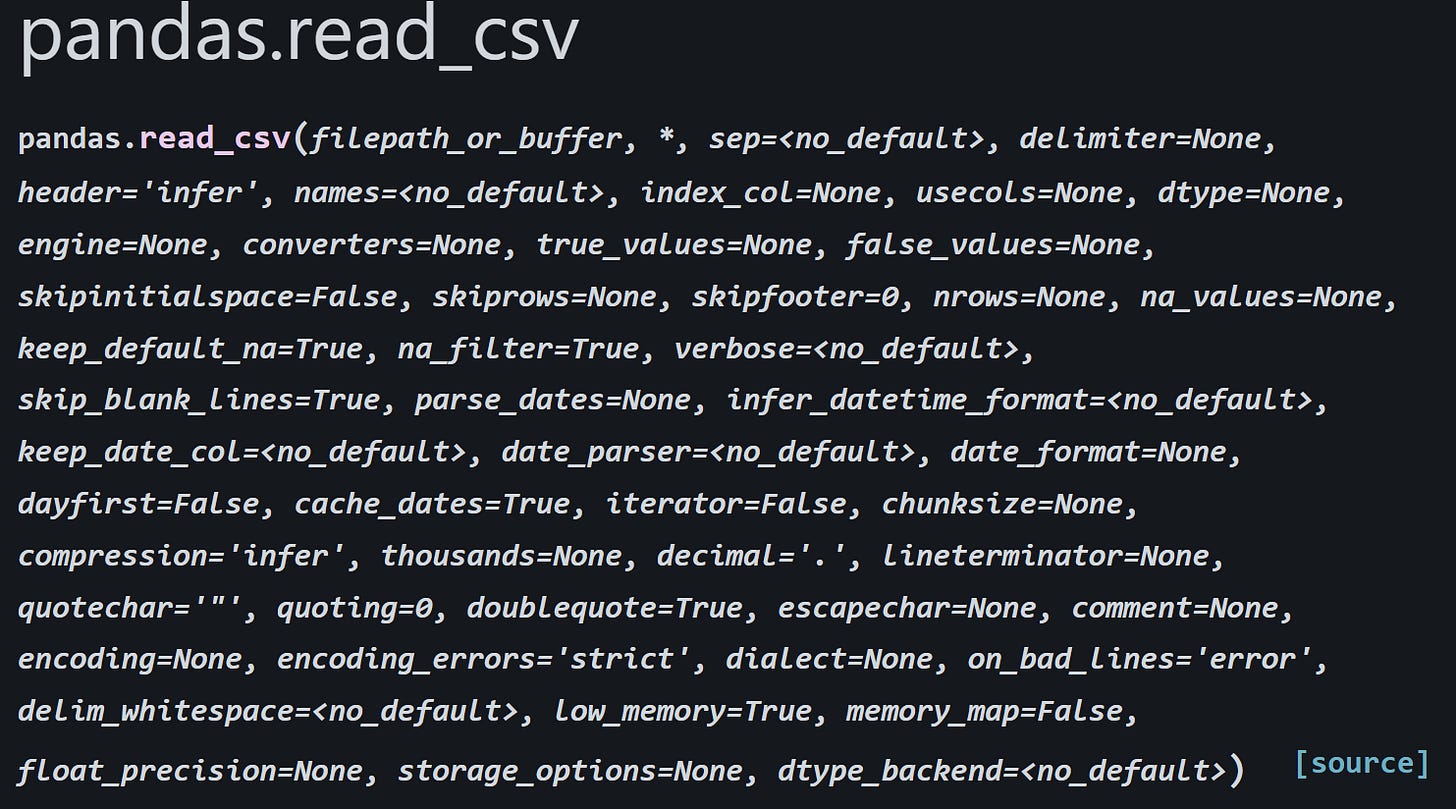
Consider the read_csv method in pandas:
It has many parameters, and people usually use it only to load in the data, but you can start your data prep with it. To understand it well, you need to come back a few times.
Plus point: Think about how you could use the new knowledge in your current project.
Plus 2 points: Ask ChatGPT to give you some problems and practice the new knowledge, or implement it in your current project.
2. Review a chart
The media is full of visualizations nowadays. When you see one, don’t just look at it as a regular person. Look at it from the data and visualization perspective.
Ask: What works? What doesn’t? How would I improve it? Why did they choose this chart type? Why this color?
You can use the r/dataisbeautiful subreddit for this exercise. You know what? Let’s do one together.
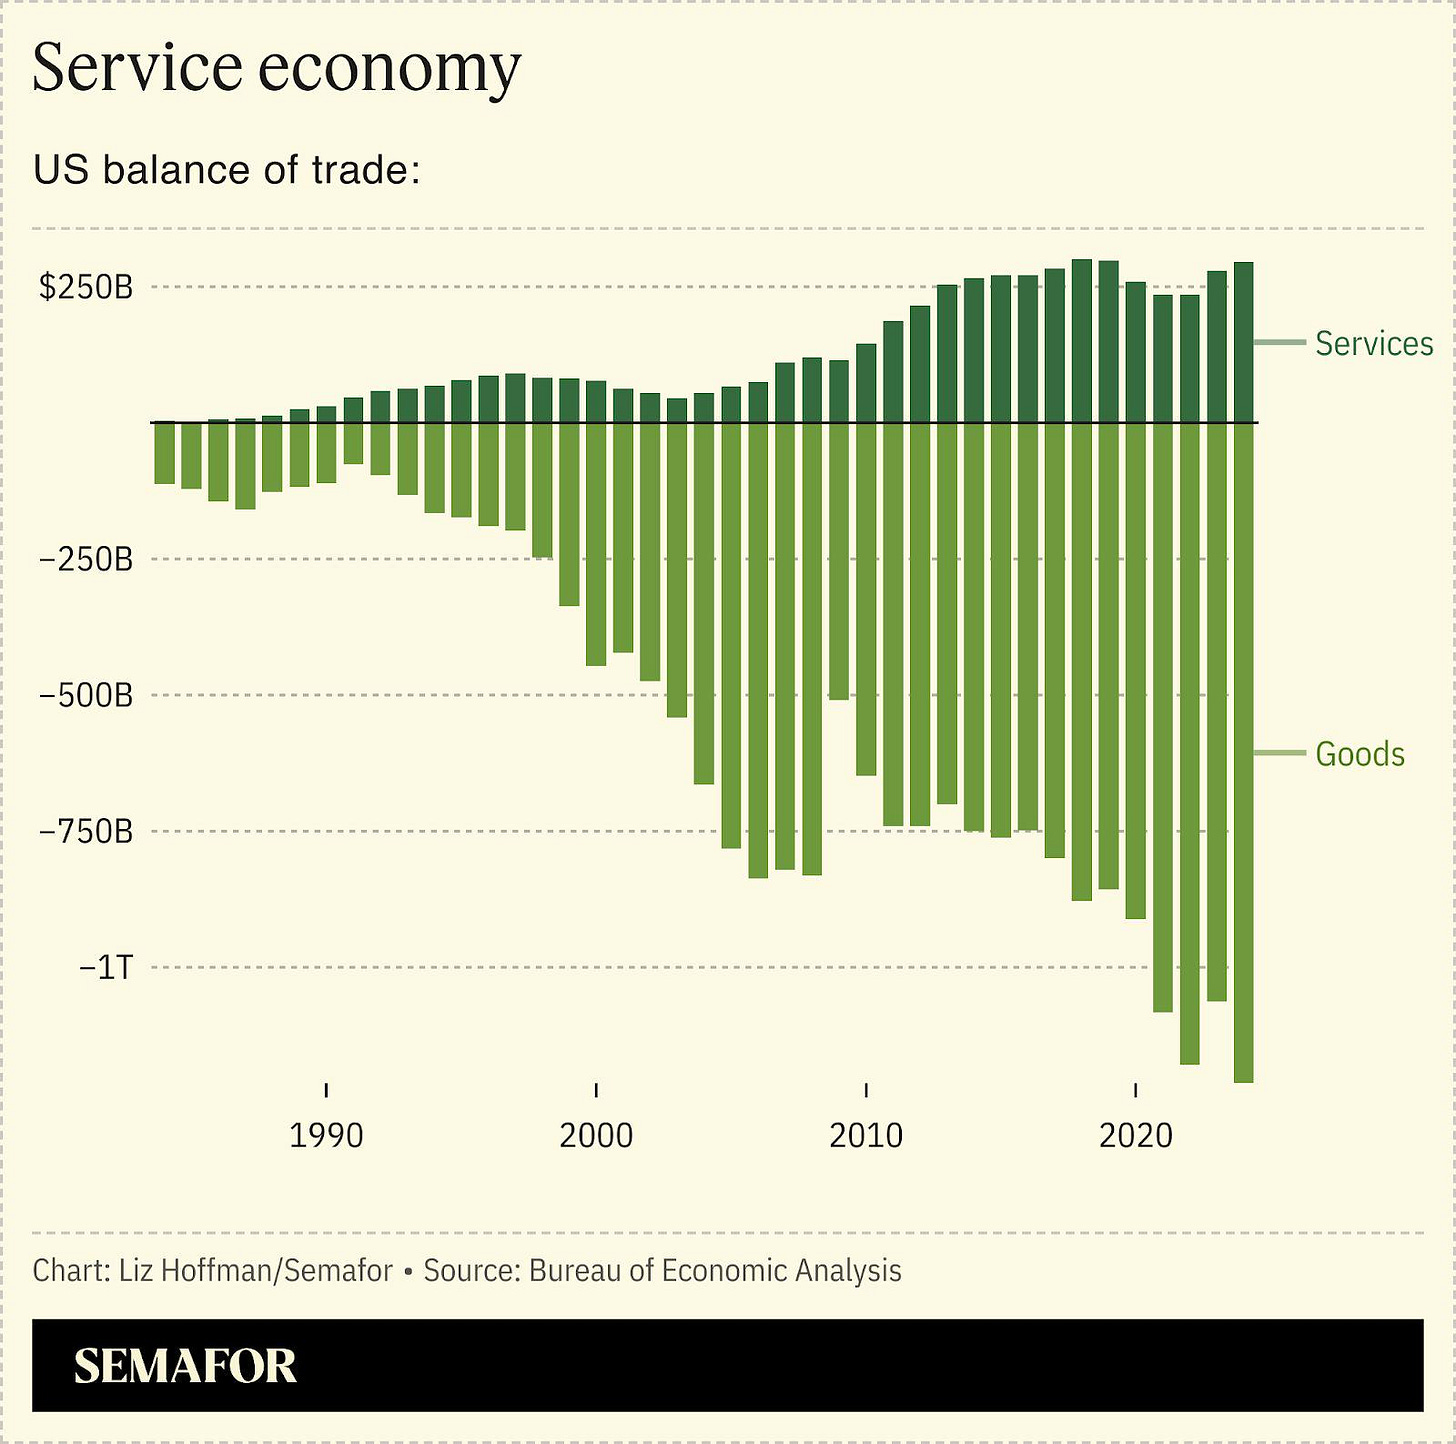
Here is the first chart that comes up for me at the moment on the subreddit:
https://www.reddit.com/r/dataisbeautiful/comments/1jv43ei/oc_us_balance_of_trade/
And here are my quick, unfiltered, thinking-loud thoughts about it:
" The title and subtitle are short, but enough for the story. The labels are clear, but the shades of colors might be too close to each other. Bigger contrast may be better - I am not sure about their color blindness score either, but they fit the background well. The Axes are clear, the distance is consistent - They don’t want to lie or form the narrative with axes manipulation. The stacked bar chart helps to see the net effect. Long enough timeframe to see the trend. The data source is also added. Straight to the point, no fluff, can build a great story around it. 10/10"
Plus 2 points: Try to recreate the chart.
3. Read articles/newsletters or watch videos
This doesn’t require any description. Watch tutorials or read posts about the tools you use or general data topics, but don’t stop there.
Sometimes, take a rest from data and learn about other relevant things like communication, presentation, business knowledge, or other soft skills that are still necessary in the field.
Plus point: Share them with friends and colleagues - Learn together
Plus 2 points: Create summaries, write notes, and share them online (see 5. point).
If we talk about business knowledge 👇
4. Translate a Business Question into Data Terms
The difference between good and excellent data professionals is the impact they make. To be impactful, you need to know the connection between business and data. This practice will help to improve here.
Take a hypothetical business question like Why are sales down in Q2? or Which customers are likely to churn? and ask: What data would I need? What metrics would I use?
Plus point: Document these business-to-data translations so you can use them as “templates”. If a similar question pops up, you just need to pull them from your pocket, and no need to start from zero.
5. Write a Data Journal
I started writing to learn. Writing on X and on Substack helped me a lot throughout my career.
Writing will help you build technical skills. You need to do research, create code snippets, go deep into topics, etc., to have a quality output.
It will also help with soft skills like presentation and clear communication. Framing your ideas effectively is something that’s really hard to master, but writing will improve it for you unnoticeably.
Another advantage is the community aspect. Writing made it possible for me to talk to awesome data experts and call them friends. From a random person, you can elevate yourself to the next shelf, and other creators will look at you differently.
Plus point: If you already have a blog or something, share with us!
Final thoughts
Spend 5 minutes on each of the above exercises every day (or a few times a week) and your career will skyrocket! Short but focused practices can add up in the long run. Of course, if you go for plus points, it can take a lot more time, but it’s an investment.
Do you have a data habit that you do daily? Let us know in the comments.


