

This Tool Will 10x Your Analysis

Feature engineering is typically considered a Machine Learning tool. But it is way more than that.
Feature engineering is when we modify or create columns or variables in our data.
You can use it in simple analysis as well, and you should. Here is why:
(At the end, I will show how I used it in my latest analysis)
Data is usually limited
We always say that more (quality) data is better. But data availability is usually limited. Sometimes it is intentional so we don’t store “unnecessary” info, or sometimes the source has gaps.
In either case, feature engineering can help you a lot. If data has gaps, you can fill them, and feature engineering is a must. In other cases, feature engineering can add some spice to the analysis.
The power of feature engineering
If you see a dataset that has only a few columns, don’t think immediately that it is not good for analysis. From a few useful columns, you can make (engineer) a lot of helpful features.

Here are some ideas for this tiny table:
From timestamp:
hour,day,weekday,month,is_weekendtime_of_day(e.g. morning/afternoon/evening/night)session_duration(time diff between user activities)days_since_last_activityis_peak_hour(based on business-defined hours)
From amount:
amount_bucket(e.g. low/medium/high spender)relative_amount(compared to the user’s average)rolling_avg_amount(per user over a period)spending_growth(compared to the previous spend)
Then, from these new columns, you can go even further, combine 2-3 columns, and build up features like a tree.
You have a lot of options to play with your data:
Create new features:
From
date_of_birth, calculateage
Encode:
Convert
education_levelinto ordinal values (e.g. HS=1, BSc=2, MSc=3)
Scale, normalize
Bin:
Categorize
transaction_amountinto “low”, “medium”, “high”Group
ageinto buckets: “18–25”, “26–35”, etc.
Extract:
From
full_name, extractfirst_nameFrom
timestamp, extractweekday
Aggregate:
Count
number_of_purchasesper userCalculate
average_order_valueper customer
Text manipulation
Handle missing data:
Use a binary flag column
income_missingto indicate NAs
The more features you have in the raw data, the easier feature engineering is. You can exponentially increase the number of features, and with that, the value of your analysis.
To be good at feature engineering, you must have great domain knowledge. Everyone can subtract two dates from each other, but the real heroes create features a rookie would never think about.
Never underestimate a basic table, since with feature engineering, you can bring it to life!
A real example
I am working with the subscribers’ data from Substack.
One feature I added is the engagement score:
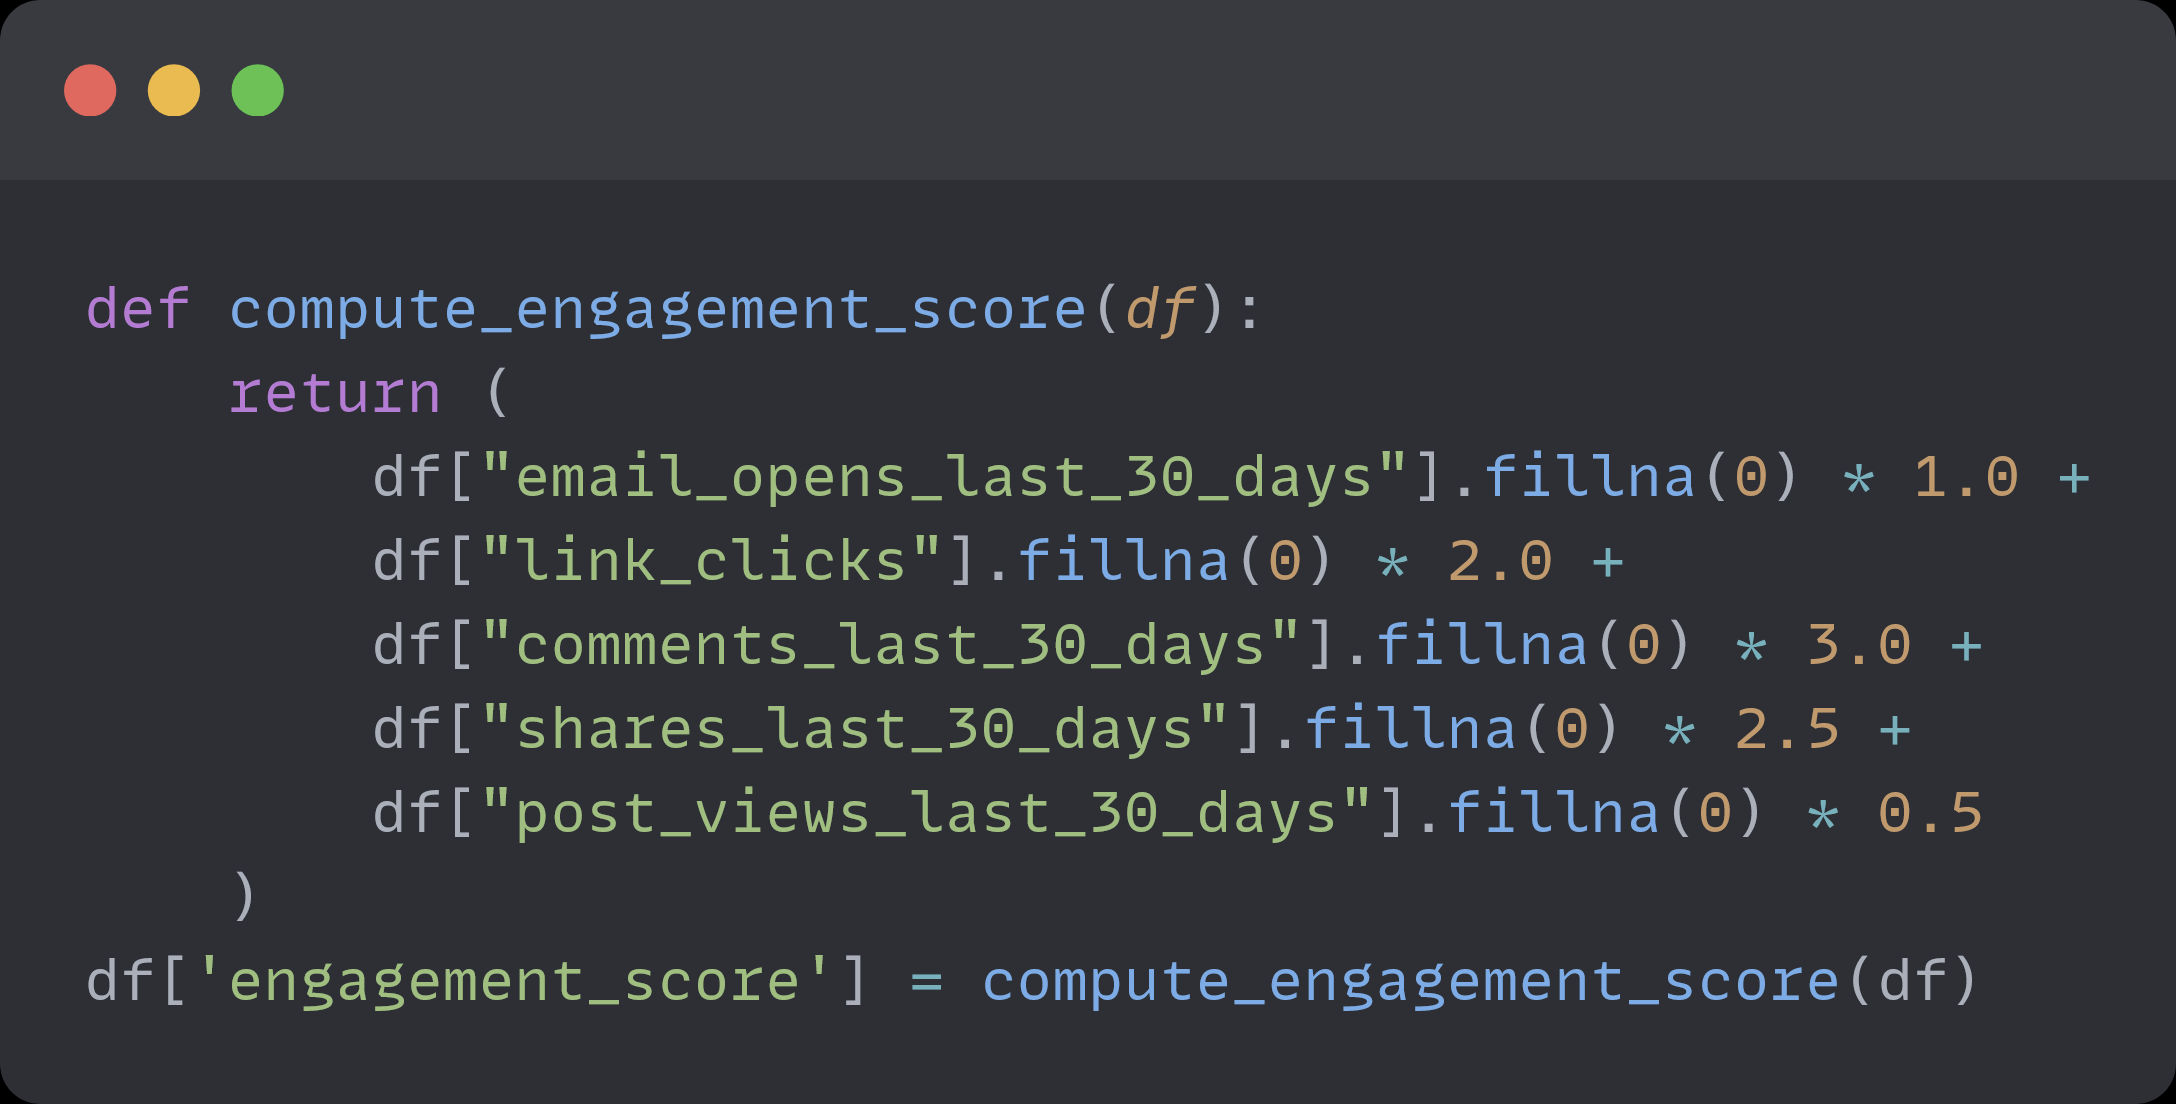
I used only existing columns from the original df, but with this new feature, I can do a lot more interesting analysis.
Substack uses the ISO 2 codes to describe a country, but Plotly likes ISO 3 codes.
Here is a function to create the data I need:
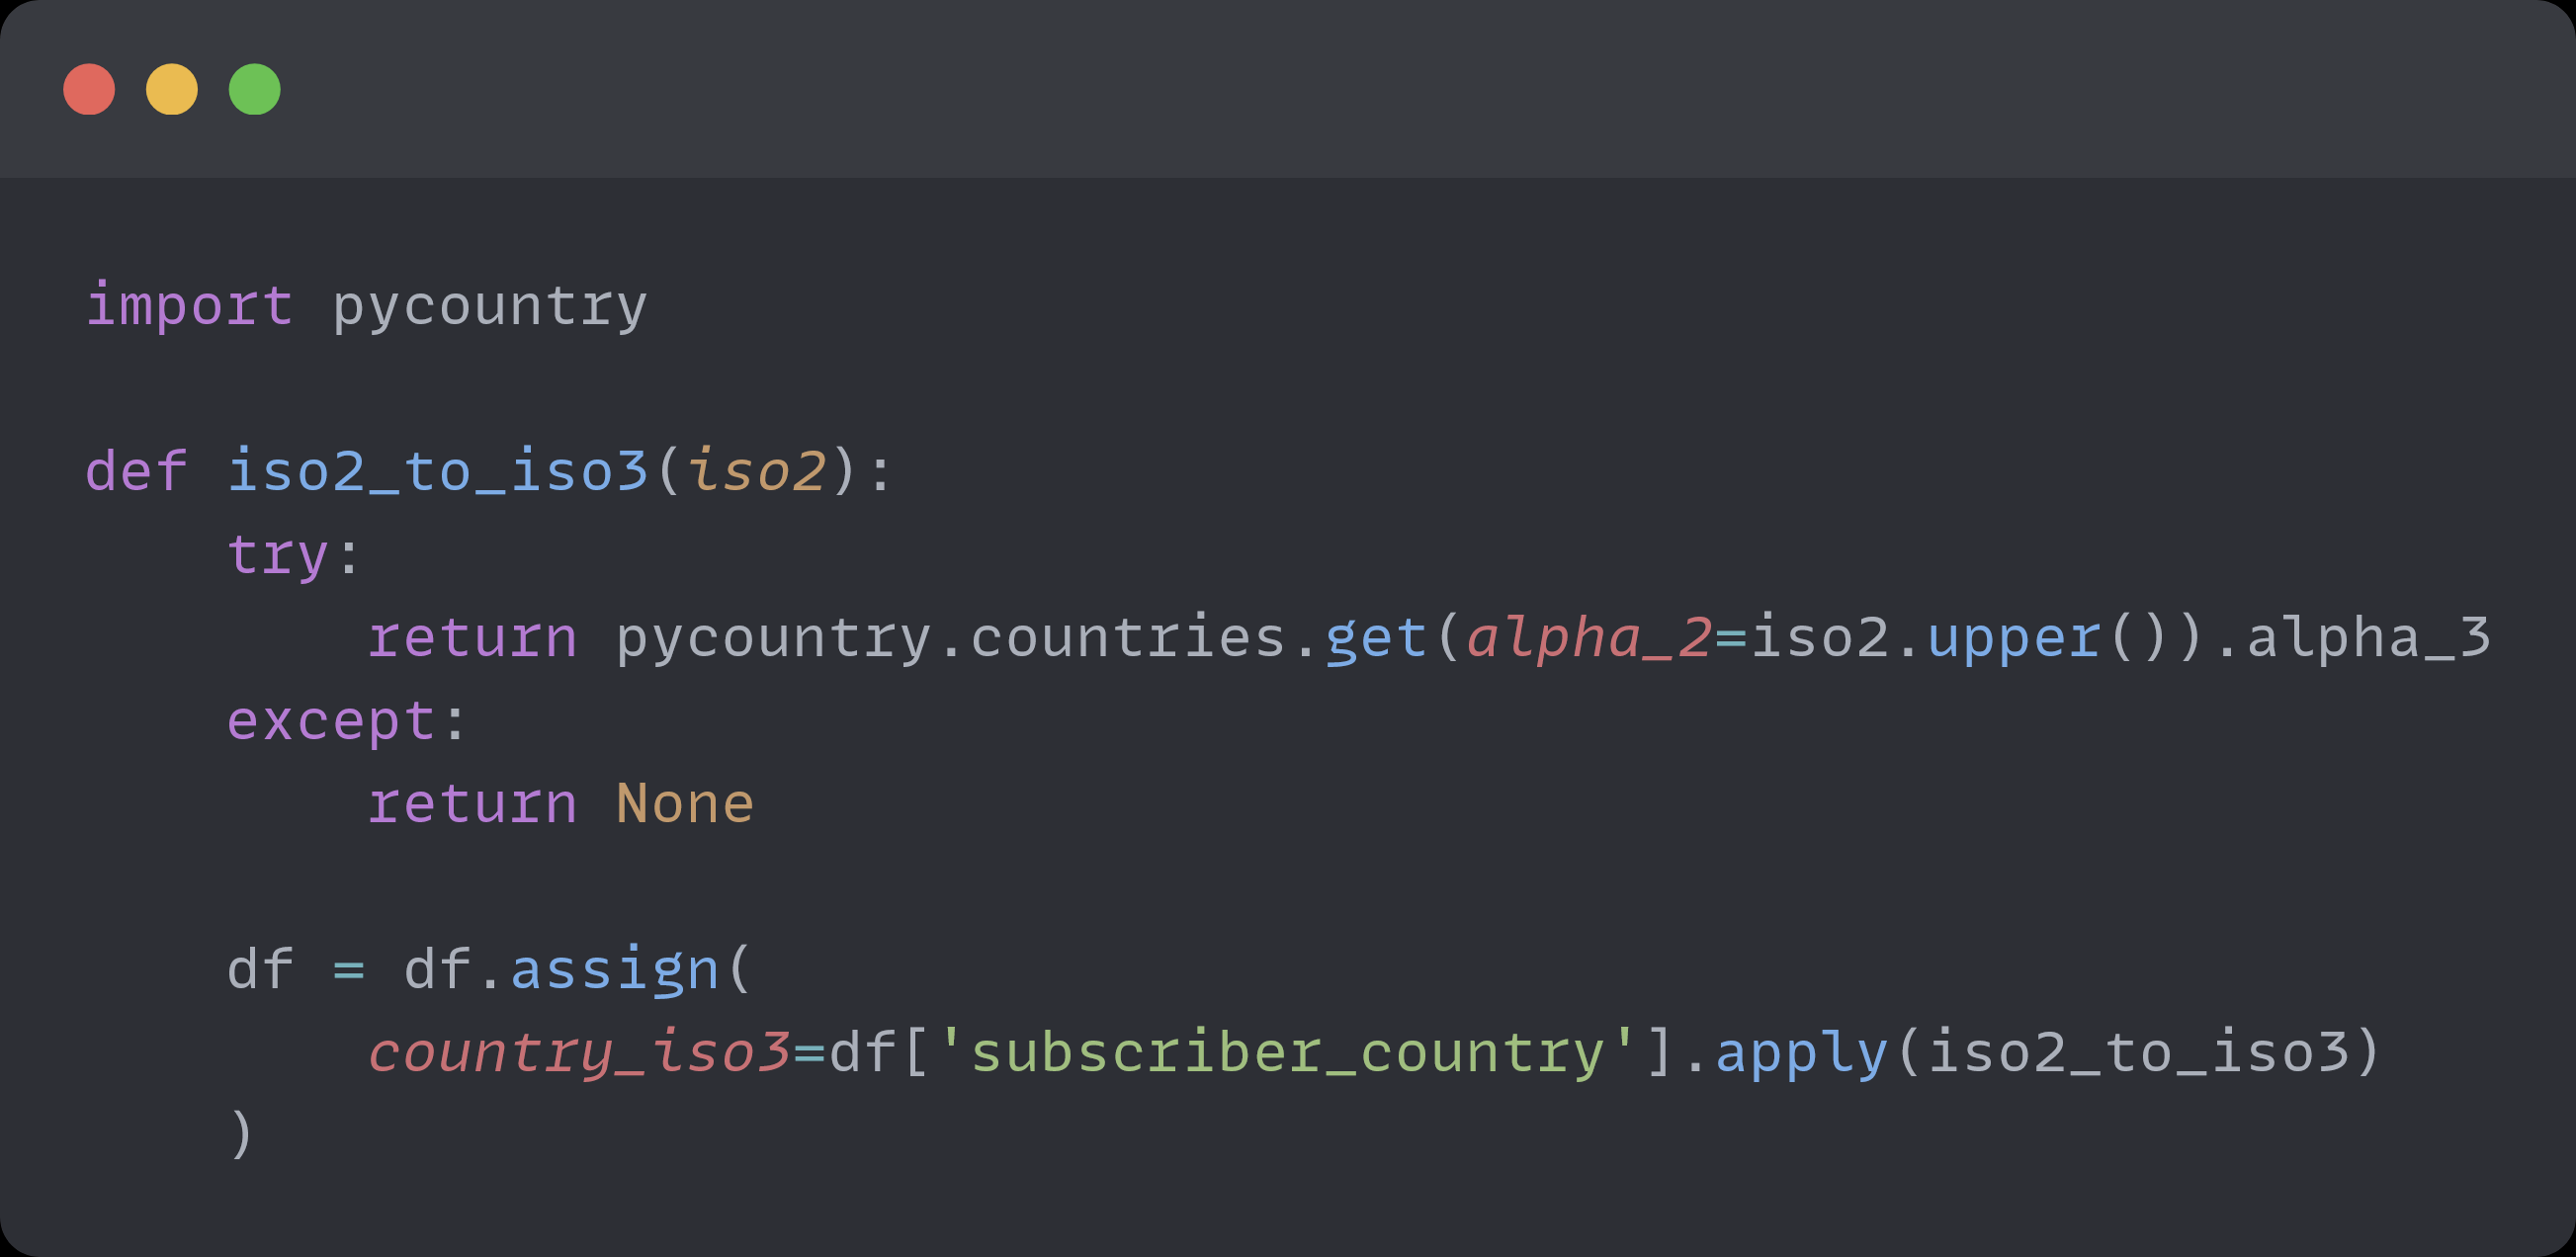
Now I can use it with plotly to create charts like this:

And here are a few more:

Get the day of week from the
subscription_dateGet the mail provider
Get the number of days since the user opened the last mail
The data Substack provides is meh, but with a bit of feature engineering, we can level it up.